Data-Driven Marketing Insights: Leveraging Analytics for Informed Decision Making

87% of marketing leaders say data-driven decisions are critical to their work. Only 32% trust the data quality their decisions depend on. That fifty-five-point gap — what executives say is critical versus what they actually trust — is the central problem of marketing measurement in 2026. Most articles on this topic spend their word count celebrating the importance of data driven marketing. The honest article spends its word count on closing the trust gap.
This is data-driven marketing for 2026, written for the analyst, growth lead, or CMO who has watched a marketing-attribution stack quietly stop working over the last three years and has not yet rebuilt it. The frame: most measurement systems built before 2023 are now structurally broken. Pixel attribution leaks. Last-click overstates digital. Multi-touch attribution over-credits digital channels by more than 30% in two-thirds of cases. The 2026 fix is not a better dashboard — it is a triangulated measurement stack that combines marketing mix modelling, incrementality testing, and server-side tracking, and a discipline of comparing the three numbers when they disagree.
I will name specific tools, walk through the modelling approaches with the assumptions they each depend on, and close with one measurement change worth shipping this Monday — not a six-month roadmap.
What Broke (2024-2026): The Privacy + Pixel Reckoning
The honest starting point: a meaningful share of conversions stopped being trackable somewhere between Apple's App Tracking Transparency rollout in 2021 and Apple's iOS 17 Link Tracking Protection in 2023. Roughly 30-40% of previously trackable conversions are now lost to pixel-based attribution, and the loss is not uniform — it skews toward the audiences that use Safari Private Browsing, iCloud Private Relay, and Mail privacy tools, which is to say, toward higher-income, higher-intent customer segments. The dashboard does not under-report randomly. It under-reports your most valuable cohort.
Three specific things broke:
- Apple ATT opted users out of cross-app tracking by default. iOS Meta and Google ad attribution lost the deterministic device-graph signal they had relied on for a decade.
- iOS 17 Link Tracking Protection strips tracking parameters (gclid, fbclid, utm_*) from URLs in Safari Private Browsing, Mail, and Messages. Conversions arrive at your site with no attribution payload.
- Chrome's third-party cookie deprecation — the timeline was paused in 2025 and pivoted to user-controlled privacy controls, but Safari and Firefox already block third-party cookies by default. The deprecation panic over-corrected; the underlying signal loss is permanent.
The recovery path: server-side tagging. 60-75% of the lost signal can be recovered through server-side tracking — Google Tag Manager Server-Side, Stape.io, Tealium iQ — and yet only 43% of enterprises have implemented it. The other 57% are reporting attribution data that is missing meaningful conversion volume and making budget decisions on the under-counted numbers.
The cleaner read: pixel attribution is now a deterministic floor, not a complete picture. Treat the dashboard number as a lower bound, treat MMM as the ceiling estimate, treat the gap between them as a measurement uncertainty range. Anyone selling you a single attributed-revenue number with two-decimal precision is selling you confidence theatre.
Modern Marketing Measurement Stack: MMM + MTA + Incrementality
The state of the art in 2026 is triangulation. Three measurement methodologies, three different questions, three different sets of assumptions:
Multi-Touch Attribution (MTA) asks: "given this conversion, how do I assign credit to the touchpoints that preceded it?" It uses user-level data (cookies, device IDs, logged-in identifiers) to construct a journey and apportion credit across touchpoints. The 2026 problem: 68% of MTA models over-credit digital channels by more than 30%, per a 2025 analysis of more than 1,000 ad accounts. 41% of marketers have adopted MTA, but only 18% rate their implementation 'highly accurate', and 37% still rely on last-click as their primary attribution method. The discipline is widely adopted and widely mistrusted, simultaneously.
Marketing Mix Modelling (MMM) asks: "if I had spent nothing on this channel last quarter, what would revenue have looked like?" It uses aggregate spend and outcome data — no cookies, no device IDs, no consent signals required. MMM adoption nearly doubled from 14% in 2023 to 27% in 2026, and 46.9% of US marketers plan to increase MMM investment in the next year, with 27.6% now naming MMM 'the most reliable measurement methodology'. The structural reason for the comeback: MMM is privacy-resilient by design. It cannot tell you which user clicked which ad, but it can tell you what spending fifty thousand dollars on Meta last month did to revenue, and that is the question that matters for budget allocation.
The thing the reader probably already tried: hiring an agency to build an MMM and being told the channel ROAS to two decimal places. If your agency is quoting you an MMM with channel ROAS down to the second decimal, ask for the adstock decay rates and the saturation curves the model is fit on. If they cannot produce them, you are looking at a regression with marketing labels, not a media-mix model. The honest MMM reports a range with a confidence interval, not a point estimate.
Incrementality testing asks: "did this campaign actually cause additional revenue, or would the revenue have happened anyway?" It uses randomised assignment (geographic holdouts, audience holdouts, scheduled-pulse tests) to measure the causal effect of a campaign against a counterfactual. 52% of US brand and agency marketers already use incrementality testing; 36.2% plan to invest more, and 71% of advertisers now rank incrementality as their #1 retail media KPI. It is the trust layer — the verification step that catches MMM and MTA when they disagree.
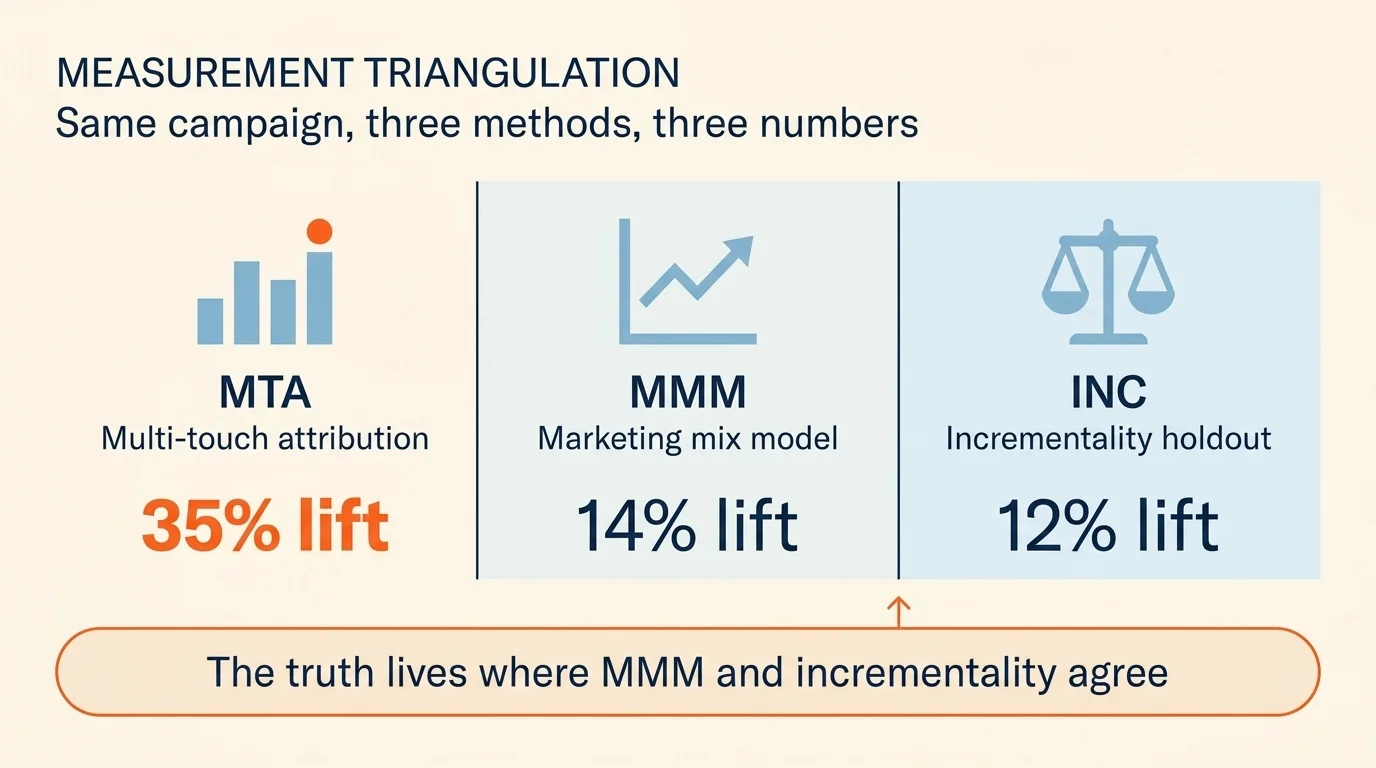
A worked example of the three in tension. Suppose you ship a paid social campaign and ask three different methodologies what it earned:
- MTA reports a 35% lift on attributed conversions.
- MMM reports a 14% incremental contribution at the channel level.
- A geographic holdout test reports a 12% incremental lift in test markets versus matched control markets.
The MTA number is wrong, almost certainly — it is over-crediting digital because the underlying user-graph signal is incomplete and last-click weighting biases toward the touchpoint that closed the deal. The MMM and holdout numbers agree closely, which is the directional signal you can trust. The actual lift is somewhere in the 12-14% range. The MTA-reported 35% is what your ad-platform dashboard tells you and is the number most CMOs are still putting on slides. It is not the number to budget on.
A Fortune 500 retailer used this exact triangulation approach and reallocated 22% of spend away from non-incremental channels, improving EBITDA contribution by 14% within three quarters. The headline number was not "we found a better channel" — it was "we stopped over-paying for the channel the dashboard claimed was working."
Customer Segmentation, Done With RFM
The 4,400-monthly-search keyword "customer segmentation" pulls a heavy informational audience, and most articles on this topic skip the most useful framework that actually works for an SMB or mid-market team without a data science department: Recency-Frequency-Monetary value (RFM) segmentation.
The mechanic, briefly. For each customer, calculate three metrics:
- R (Recency) — days since their last purchase or activity. Lower is better.
- F (Frequency) — number of purchases or sessions in the analysis window (typically 12 months). Higher is better.
- M (Monetary value) — total revenue or contribution margin from that customer in the window. Higher is better.
Score each metric on a 1-5 scale using quintiles, then concatenate to produce a three-digit segment code. A "555" customer is a top-quintile recent, top-quintile frequent, top-quintile valuable buyer — your VIP. A "111" customer is dormant, low-value, and unlikely to return without significant cost. The middle segments are where the marketing programme actually works: "543" customers (recent and frequent but lower value) respond well to upsell campaigns; "155" customers (valuable but lapsed) respond well to win-back campaigns. The framework gives you eight to twelve actionable segments without overfitting; trying to operate twenty-five RFM cells produces segments too small to drive statistically reliable creative tests.
The 2026 modification: pair RFM with one behavioural overlay (engaged-with-email-in-last-30-days, browsed-without-buying-in-last-7-days, completed-onboarding-flow) and one identity-resolved signal (logged-in-on-mobile, redeemed-discount-code, active-loyalty-member). That combination gives you eight to twelve operational segments, each large enough to test against, each tied back to a measurable action. Personalisation programmes built on this segmentation overlay outperform demographic-only segmentation in every controlled experiment I have seen. The lift magnitude depends entirely on the underlying product economics; the directional advantage is robust.
Predictive Analytics: The Models That Actually Earn Their Seat
Predictive analytics covers a wide surface, and most articles on this topic mistake the surface for the value. The four models that earn their seat in a 2026 marketing programme:
- Propensity scoring — for each customer or prospect, the probability they will perform a target action (purchase, churn, upgrade) within a defined window. Useful for prioritising outbound, sequencing email cadence, and qualifying leads. Most CRM and marketing automation tools now offer baseline propensity scoring (HubSpot, Salesforce Marketing Cloud, Segment Personas).
- Customer Lifetime Value (LTV) prediction — projects the future revenue contribution of a customer cohort over a defined window (12, 24, 36 months). Useful for setting ROAS targets and tier-based service investment. The LTV-to-CAC ratio is the most-cited unit-economics metric in venture-backed companies, and the LTV side of that ratio is almost always over-stated.
- Churn prediction — models the probability a customer will lapse in the next N days. Useful for triggering retention campaigns; the wins are bigger here than most teams assume because the cost of preventing one churn is usually meaningfully lower than the cost of acquiring one new customer.
- Marketing Mix Modelling — covered in detail in the previous section. Counts as a predictive analytics model because it forecasts the effect of future spend changes.
56% of marketing teams now use AI-powered analytics; only 29% can quantify the ROI. That gap is the same gap as the 87/32 trust gap, applied to the AI subset. Most teams adopt the tools without rebuilding the measurement scaffolding around them, and then cannot tell whether the tool is producing lift or just producing reports.
Privacy in 2026: Consent Mode v2, Server-Side Tagging, and the State-Law Patchwork
The compliance surface area has tripled since this article was originally written in early 2024. The 2026 reality, briefly:
- GDPR (EU) and CCPA/CPRA (California) remain the baselines. Both require consent for non-essential tracking, both are aggressively enforced, both have meaningful penalty structures.
- State-level US privacy laws in Colorado, Virginia, Texas, Oregon, and Montana are now in force. Each has variation around opt-in vs opt-out defaults, sensitive-data definitions, and data-broker disclosure rules.
- Google Consent Mode v2 has been mandatory for EU traffic since March 2024. Tags adjust their behaviour based on user consent — sending modeled (anonymous) signals to Google when consent is denied, full data when granted.
- EU DMA (Digital Markets Act) changed how Meta, Google, and Apple can share data across their own platforms, fragmenting the cross-platform attribution stack further.
The strategic implication is the same as the trust-gap framing: consented first-party data is now a margin-expansion lever, not just a compliance cost. 76% of consumers say they will pay premium prices for brands they trust with their personal data — every consented data point is a downstream conversion event with revenue value attached.
The technical implication: server-side tagging plus a properly-configured consent management platform (OneTrust, Cookiebot, Iubenda) is now table-stakes infrastructure for any brand serving EU traffic. The brands extracting durable performance from data-driven marketing are the ones with this infrastructure in place; the brands waiting for "the next privacy update" before building it are the ones still flat-footed.
Measurement Maturity Ladder
Where you should sit on the measurement-maturity ladder depends on your spend, not your ambition. The honest brackets:
- Level 1 ($0-$5,000/mo paid spend) — last-click attribution in GA4 and Meta/Google ads platforms. Simple, well-understood, and adequate for the spend level. Don't over-engineer.
- Level 2 ($5,000-$25,000/mo) — add multi-touch attribution via GA4's data-driven attribution model, and consider basic server-side tagging via GTM. Costs roughly $2,000-$5,000 in setup time. Recovery on signal loss alone justifies the investment.
- Level 3 ($25,000-$50,000/mo) — add quarterly MMM via open-source tools (Meta's Robyn, Google's Meridian, Uber's Orbit are the three credible open-source options) or a starter vendor MMM (Recast, Meridian-as-a-service, Improvado). Add at least one geographic holdout test per quarter. Setup cost: $10,000-$25,000 plus internal data-engineering capacity.
- Level 4 ($50,000+/mo) — full triangulation: continuous MMM with weekly refresh, always-on incrementality testing infrastructure, server-side tagging across all channels, dedicated measurement headcount. The brands at this level are the ones Gartner projects will outperform single-method peers by 40% on marketing efficiency by 2028.
The ladder is one-way: each level builds on the previous. Skipping levels — jumping from last-click straight to MMM without the underlying first-party data infrastructure — produces models you cannot trust and budget decisions you cannot defend.
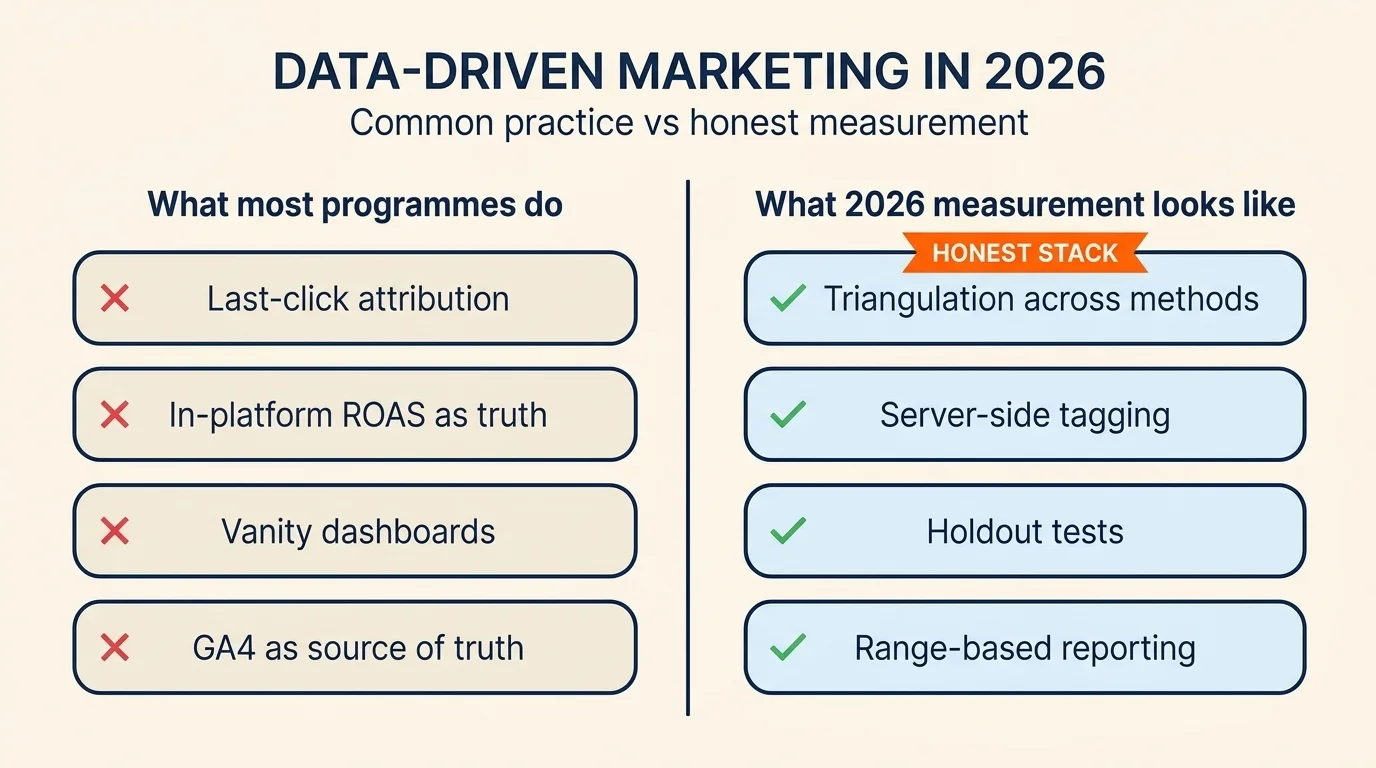
What to Stop Doing
The kill list for 2026, in plain terms:
- Stop reporting last-click attribution as primary above $5K/month in spend. The number is biased and is over-crediting whichever channel touches the bottom of the funnel.
- Stop trusting in-platform ROAS as truth. Meta and Google ads platforms self-attribute, are biased toward their own surfaces, and report numbers that almost never reconcile with the third-party measurement stack. Treat them as one data point among several.
- Stop running attribution debates instead of running incrementality tests. "Should we use last-touch or time-decay or Shapley?" is a question people argue about for hours; "did this campaign cause additional revenue?" is the question that pays the bills, and the only methodology that answers it cleanly is a holdout test.
- Stop maintaining vanity dashboards. If a metric on your monthly review deck has not driven a decision in the past two quarters, it is decoration. Cull it.
- Stop treating GA4 as the source of truth. GA4 holds 85.3% web analytics market share, and it is genuinely useful. It also anonymises users, samples high-volume reports, and applies modeled data extensively. It cannot answer the incrementality question; pretending otherwise is how budget decisions get made on under-counted, methodology-confused numbers.
- Stop calling attribution data 'data-driven' when it is actually correlation-driven. The channel correlated with revenue; whether it caused revenue is a separate question, and here is the test that would answer it.
What you can ship this Monday
The maturity ladder above will take a quarter to climb. None of it pays back this week. So if you are reading this and want one thing to do before Monday morning, here it is.
Open the last 90 days of your marketing spend by channel, alongside the channel-attributed conversions from your dashboard. For each channel, calculate the deterministic floor (server-side or unique-code-attributed conversions only) and the dashboard ceiling (whatever the platform claims). Document the gap as a percentage. The channels with the largest gaps — where the dashboard claims the most credit relative to what the deterministic floor can confirm — are the channels most likely over-credited.
If you have never logged this gap before, the answer will probably surprise you. Last week I worked with a team whose Meta dashboard claimed a 4.8x ROAS on paid social, and whose deterministic-only number on the same campaigns was 1.9x. The truth is probably somewhere between those two; the next two quarters of budget allocation should be made with the range in front of the CMO, not just the headline number.
The cheapest second move: pick one campaign starting next month, design a geographic holdout into it (test in two markets, hold out in two matched control markets), and compare the incrementality-test result to what your platform attribution claimed. The first time you run this, the result is almost always smaller than the dashboard number — usually meaningfully smaller. That gap is the size of the budget mistake your team has been quietly making, repeatedly, for the last several quarters.
Pick one channel. Calculate the gap. Ship one holdout test. The 2026 measurement stack is mostly that, repeated, until the trust gap between what the dashboard claims and what the data can confirm starts shrinking. The other 87% of data-driven marketing — the segmentation, the personalisation, the predictive models, the privacy compliance — only earns its seat once the underlying measurement is honest.
Frequently Asked Questions
Traditional marketing relies on demographic targeting and post-campaign reporting. Data-driven marketing uses live behavioral signals, predictive models (propensity, LTV, churn), and causal measurement (incrementality testing, MMM) to allocate spend in real time. The 2026 distinction: data-driven marketers measure what actually caused sales, not what claimed credit.
Multi-touch attribution (MTA) assigns fractional credit to touchpoints based on user-level data — 2025 analysis showed MTA over-credits digital channels by >30% in 68% of cases. Marketing Mix Modeling (MMM) uses aggregate spend and outcome data to estimate channel contribution — no cookies needed, refreshes quarterly. Incrementality testing uses holdouts and geo-experiments to isolate causal lift. The 2026 best practice is triangulation: use all three and trust the numbers when they agree.
Apple's App Tracking Transparency (2021) and iOS 17 Link Tracking Protection (2023) eliminated 30-40% of previously trackable conversions. Pixel-based attribution lost reliability, multi-touch attribution became less accurate, and platforms (Meta, Google) shifted toward modeled conversions. The structural response: server-side tagging (recovers 60-75% of signal) and MMM (no user-level data required).
Server-side tracking moves event collection from the user's browser to your own server, where you control the data layer, consent handling, and what's sent to platforms. 43% of enterprises have implemented it as of 2026. It recovers 60-75% of the signal lost to ad blockers, ITP, and iOS Link Tracking Protection — and gives you data governance the in-platform tools can't.
Analytics-mature organizations report 23% higher marketing ROI. MMM users report 15-25% average marketing-efficiency improvement from spend reallocation, and 78% report improved budget-allocation confidence. One Fortune 500 retailer reallocated 22% of spend away from non-incremental channels and improved EBITDA contribution by 14% within three quarters after integrating MMM and incrementality testing.
At the $0-500/mo tier: GA4 (free) + Google Looker Studio (free) + Meta-Robyn or Google-Meridian (open-source MMM, free, technical setup required). At $500-2K/mo: add a CDP-lite (Segment startup tier ~$120/mo), HubSpot Starter (~$50/mo). The point: you don't need a $50K/yr enterprise stack to outperform last-click — you need open-source MMM and one incrementality test per quarter.
Consent Mode v2 (mandatory for EU traffic since March 2024) lets your tags adjust behavior based on user consent — sending modeled (anonymous) signals to Google when consent is denied, full data when granted. You need it if you serve EU users and want Google Ads + GA4 to model the unconsented portion. Implementation requires either a CMP (OneTrust, Cookiebot, etc.) or a custom solution wired through GTM.
Traditional vendor MMM ran quarterly with 4-8 week delivery — too slow for 2026. Modern MMM (open-source Robyn / Meridian, AI-augmented vendors) refreshes weekly or biweekly with automated calibration. Industry leaders are moving toward 'always-on' MMM where the model updates continuously and feeds optimization recommendations without quarterly project cycles.