Digital Marketing Decoded: The Art and Science of Online Influence

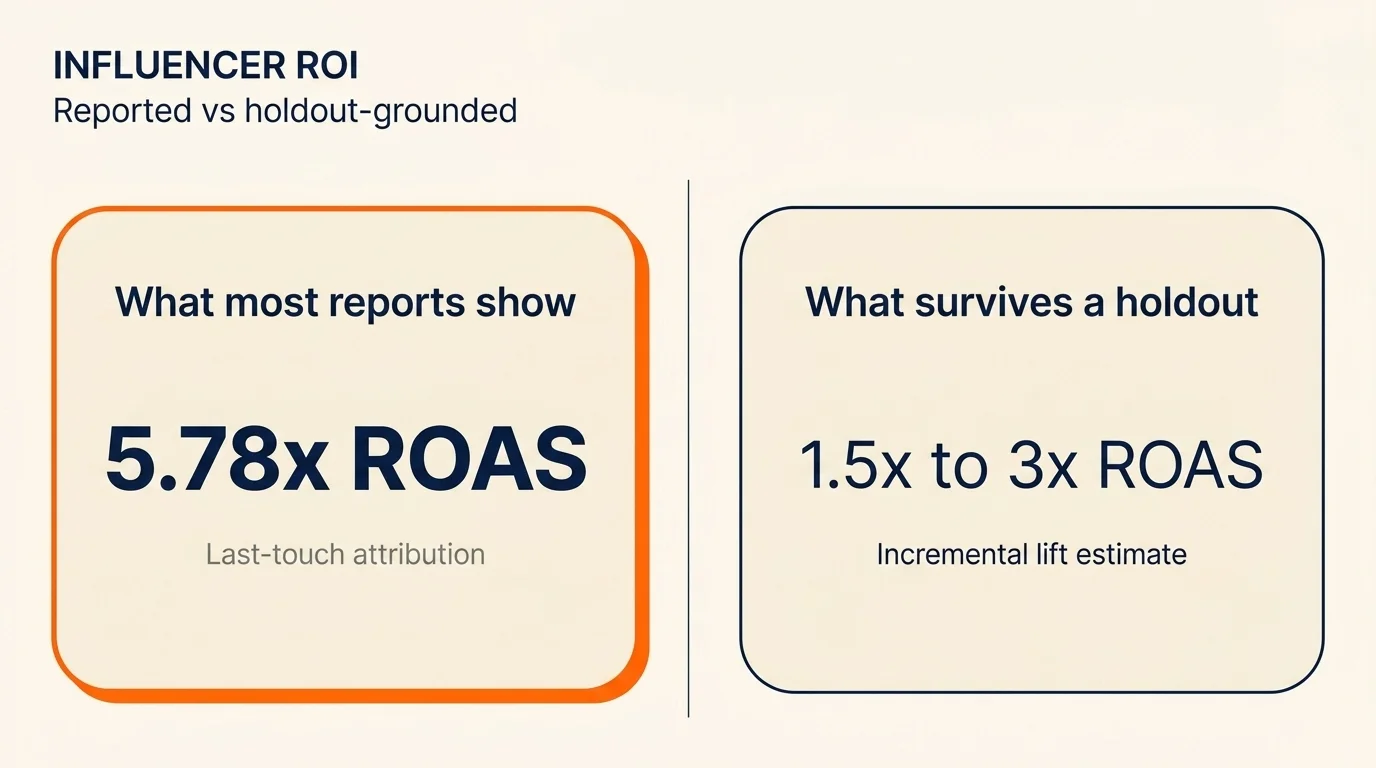
The headline ROI number cited in nearly every influencer marketing strategy deck for 2026 is $5.78 returned for every $1 spent, with top campaigns reportedly hitting $11 to $18. It is the kind of number you put on a slide and no one questions, and it is also the kind of number that does not survive a five-minute methodology review. Most of the figures that produced that aggregate were calculated against last-touch attribution, with no holdout, on campaigns that the brand had self-selected into running because the previous campaigns had also worked. A clean read of incremental influencer ROI — randomised holdout, matched cohort, post-period revenue — almost always lands meaningfully lower. Still positive. Still worth the spend. Just smaller than the slide.
This is an influencer marketing strategy guide for 2026, written for the marketer who has to defend the spend in front of a CFO who has been burned by attribution theatre before. I will name tier rate cards specifically. I will flag where consumer-survey data is being treated as causal evidence. I will walk through the FTC changes most articles still skip. And I will close with one measurement change worth shipping this Monday.
The Numbers Most Influencer-Marketing Articles Lead With
Before the methodology critique, the numbers themselves are worth listing. The 2026 influencer-marketing market sits at $39.33 billion, up from $32.55 billion in 2025 — roughly a 21% year-over-year market growth. 74% of marketers plan to increase their influencer budgets in 2026, and 21% more organisations are working with influencers compared to a year earlier. Sprout Social reports that 86% of consumers make annual purchases inspired by influencers, and 49% buy monthly.
The directional read is unambiguous: budgets are up, adoption is up, consumer-side resonance is up. The cleaner read on the magnitude is: the $5.78-per-$1 average is a category aggregate that smooths over a wide variance. SMB campaigns at $500-$2,000 monthly land below the average. Long-running ambassador programmes at the high end land well above it. Treating the headline ROI as the budgeting baseline is exactly how a CFO ends up disappointed in a quarter.
The Trust Stack: How Authority, Reputation, and Influence Compound
Most influencer marketing strategy guides treat brand authority, online reputation management, social proof, UGC, and influencer marketing as five separate channels with five separate playbooks. That framing makes the topics easier to write about; it also misses the actual operating model.
In the operating model, these layers compound. Brand authority — the sustained editorial track record that makes a brand cite-able — sets the ceiling on how much an influencer can move. Online reputation management — what shows up when someone Googles the brand after seeing the influencer post — determines whether the click converts or bounces. Social proof and UGC — the customer reviews and reposts that surface beneath the paid post — control how trustworthy the partnership reads. Influencer marketing is the visible top of the stack; the layers underneath decide what happens when the user actually arrives at the brand's site.
The implication for measurement: influencer ROI in a brand with a weak ORM foundation will systematically under-perform influencer ROI in a brand with a strong one, even at identical creative and identical creator selection. If your last influencer campaign disappointed and your reputation surface (review sites, Google Knowledge Panel, AI platform mentions) is messy, the campaign was probably fine. The stack underneath was leaking.
Online Reputation Management: The Foundation Your Influencer Spend Sits On
The keyword "online reputation management" carries a $76 CPC and roughly 5,400 monthly searches in the US — those numbers reflect commercial demand from brands actively shopping for ORM solutions. The 2026 reality is broader than the traditional review-management framing.
Three things changed in the last two years and the playbook should reflect them. First, AI platforms (ChatGPT, Perplexity, Google AI Overviews) now surface brand mentions inside their answers, and those answers are sometimes wrong — hallucinated CEO names, outdated claims, attribution to the wrong company. The tools to monitor and remediate AI hallucinations about your brand are emerging (Brandlight, Profound, Otterly) but the discipline is mostly manual: query each major AI platform monthly for your brand and core products, log inaccuracies, and submit corrections through whatever channels each platform supports. Second, review velocity matters more than review count, both in Google's local pack and in AI platform citation ranking. A steady cadence of fresh reviews now beats a one-time push of fifty old ones. Third, social listening is no longer optional for brands above $5M in revenue — Brandwatch, Sprinklr, and Talkwalker all serve this market, and the tooling has narrowed to roughly comparable.
The connection back to influencer marketing: the brands that under-perform on creator campaigns almost always have an ORM gap upstream. Audit the reputation surface before you negotiate the next creator contract.
The Tier Comparison That Should Anchor Every Strategy Decision
Most 2024-era influencer marketing strategy articles treat creators as a single category. The 2026 reality has clearly tiered, and the engagement and cost dynamics differ enough that the tier choice is the strategy choice.
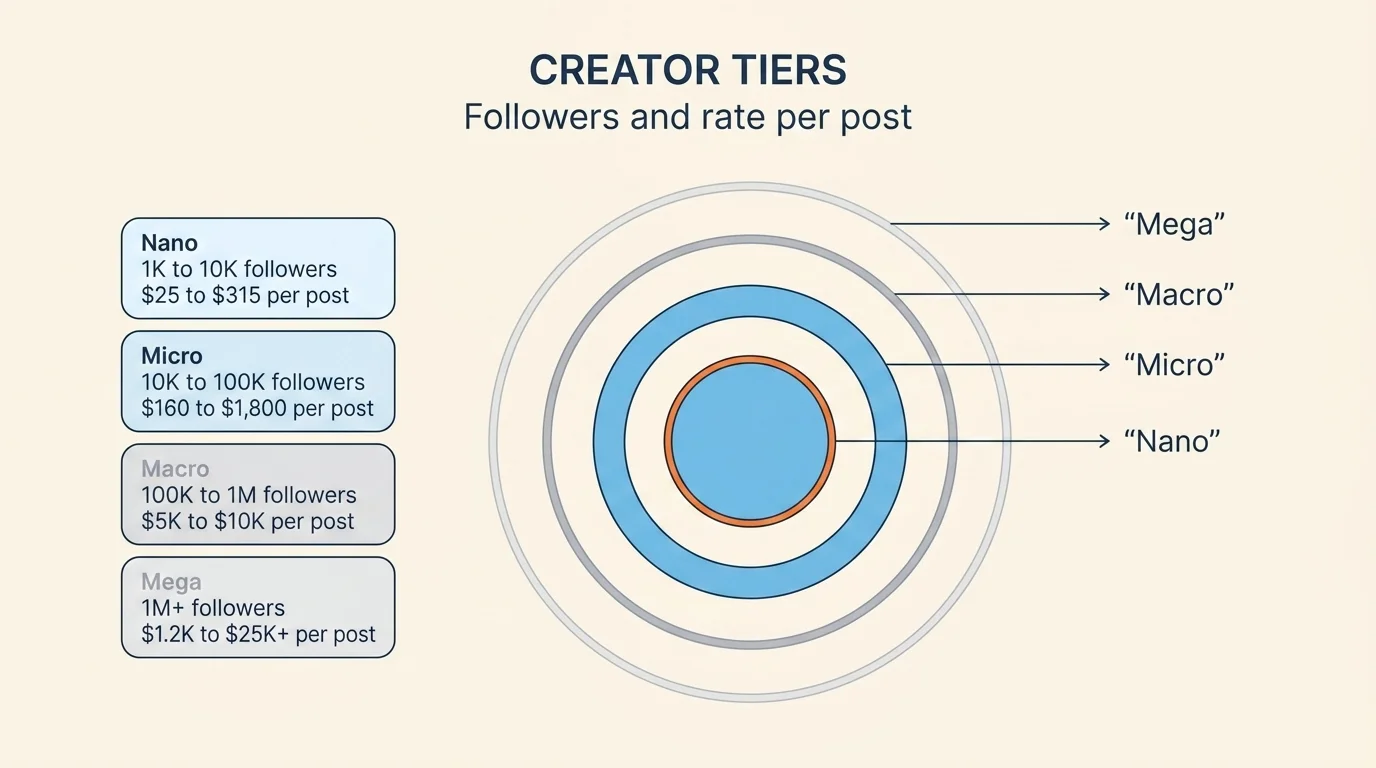
Hootsuite's 2026 rate data — usable as benchmark, not contract:
- Nano (1K–10K followers) — $25 to $315 per post. 2.71% engagement rate, 60% higher than mega creators. Nanos make up 75.9% of Instagram's influencer base, and 27% of marketers say nanos are now their primary partner tier.
- Micro (10K–100K) — $160 to $1,800 per post. Engagement rates land between nano and macro; another 27% of marketers primary-partner here, making nano + micro the default 54% of the market.
- Macro (100K–1M) — $5,000 to $10,000 per post. Engagement rates drop below 1%. The cost-per-engagement math gets harder to justify outside of awareness-stage campaigns with broad-reach KPIs.
- Mega (1M+) — $1,200 to $25,000+ per post (the lower bound is for product seeding rather than dedicated content). Engagement rates are the lowest in the stack; the use case is brand-association not conversion.
82% of consumers are more likely to buy from a micro-influencer than from a celebrity creator. Read that stat with the holdout caveat — it is stated-preference survey data, not observed-behaviour data — but the directional read is consistent across studies. The implication is straightforward: at SMB and mid-market budgets, the math overwhelmingly favours nano and micro tiers over the celebrity creators most older articles still recommend.
How Creator Compensation Has Shifted
The flat-fee post-by-post model is collapsing and being replaced by hybrid structures: a small retainer plus performance-based commission, ambassador agreements with quarterly content commitments, or product-seeding arrangements with an affiliate code attached. 63% of creators now prefer long-term campaigns over one-offs, and 31% of 2026 campaigns now use product seeding, up from 20% the prior year.
The measurement implication is the part most articles skip. Performance-based compensation only works if the attribution stack underneath it can correctly assign revenue to the creator. A flat fee makes you over-pay for under-performing creators; a poorly-attributed performance deal makes you over-pay for the wrong creators. The cleanest setup uses unique discount codes per creator combined with UTM-tagged landing pages, with a server-side conversion event that fires on purchase rather than relying on third-party cookies — those have been unreliable since iOS 17 link-tracking protection started stripping URL parameters in Safari.
Pay particular attention to how you handle returns. A creator who drives high gross-revenue on a discount code but a 40% return rate is not delivering the same value as a creator with lower gross and a 5% return rate, and the headline GMV figure your dashboard reports will treat them identically.
Creator-Led Content Is Now Paid-Media Creative
This used to be three separate sections — visual marketing, social proof, content amplification. The 2026 data collapses them. 77% of marketers now repurpose creator content into paid social, and 69% report creator-led ads outperform brand-directed creative. The implication is that the content rights clause in your creator contract is no longer a footnote — it is one of the highest-value lines in the agreement.
Negotiate at minimum a 90-day usage right for paid social on the platform the original was posted, with an option to extend. For content with strong organic performance, a 12-month right is worth paying a premium for. The math: a creator post that costs $300 and produces top-quartile engagement, then runs as a paid-social ad creative for three months at $5,000/month spend, has effectively bought the brand a piece of high-performing creative for the cost of one nano-tier post. That is the second-order ROI on creator partnerships that the headline $5.78/$1 number does not capture.
Social Proof, UGC, and the 161% Conversion Number
The headline UGC stat is that UGC-enabled product pages convert 161% higher than pages without, with UGC social posts driving 10.38x more conversion than brand-led posts and just 10 reviews lifting conversion roughly 45%. Treat those numbers carefully. The 161% lift is observational data — pages with UGC tend to be more mature, better-trafficked, and on better-performing products to begin with. The cleaner read of UGC's incremental contribution lands lower than 161%, but the directional signal is robust enough across studies that the practical recommendation does not change: ship UGC on product pages.
The wider trust-stack data: 96% of consumers rely on UGC when making a purchase decision, and 68% say UGC is the most authentic content format, up from 60% the prior year. Authenticity, in the consumer-psychology sense, is now the operative variable. Polished brand-shot creative is not just under-performing UGC — it is being actively discounted by audiences trained on creator-led content for two years. The strategy implication for the broader digital marketing programme is that the visual content stack has inverted: creator-led is the default, brand-shot is the exception.
FTC Compliance in 2026: What Actually Changed
This section is missing from every competitor article ranking on this query, and it is the section a brand counsel will actually read. The FTC issued formal actions against 15 influencers and brands in the first half of 2025 — a 40% increase from 2024, with penalties ranging from $10K to $100K+. The enforcement direction is clear: the regulator is now looking at brands as co-liable, not just at creators.
The disclosure requirements that changed:
- AI-generated endorsements must be labelled as AI-generated. This includes synthetic creator content, AI voice-overs of real creators, and any deepfake-style asset. The "contains AI" label is now the operative standard.
- TikTok Shop affiliate relationships need explicit disclosure if there is compensation beyond TikTok's built-in affiliate tag. The platform tag alone is not sufficient when extra brand compensation is in play.
- Brand co-liability is now the default. A creator who omits a #ad disclosure does not absolve the brand. Brands are expected to have a documented disclosure policy in their creator contracts and to monitor compliance.
- Disclosures must be clear, conspicuous, and immediately apparent. Buried in a comments section, hidden behind "more", or stacked in a hashtag pile after fifteen unrelated tags does not qualify.
The cheapest 2026 fix: a one-page disclosure clause in your creator contracts referencing the FTC's "clear and conspicuous" language, plus a quarterly compliance audit run by whoever owns brand legal. The cost of doing this is in the hundreds; the cost of not doing it has just gone up by 40%.
Measuring Influencer ROI Without Lying to Yourself
This is the section where the rest of the article is in service. There are three honest ways to measure influencer ROI in 2026, and there is a long list of dishonest ones that most dashboards still report.
Direct attribution via unique codes. Each creator gets a unique discount code and UTM-tagged landing page. Revenue attributed to the code is the deterministic floor. This works well for ecommerce, less well for considered B2B purchases where the buying journey spans weeks. It under-attributes — a creator who influences a purchase that ultimately uses a different code or no code at all looks worse than they are.
Geographic or audience holdouts. Run the campaign in two test markets, hold it out in two matched control markets, compare incremental revenue. This works for awareness-tier campaigns where direct attribution is impossible. Setup cost is two weeks of design work; once running, it produces the cleanest causal estimate available.
Marketing mix modelling. Regress revenue against influencer spend at a weekly grain, alongside other channel spend. Worth the effort above roughly $50,000/month in influencer spend; not worth it below. The honest version requires adstock decay rates and saturation curves explicitly fitted — anyone selling you an MMM with channel ROAS to two decimal places, without those parameters, is selling you a regression with marketing labels.
The dishonest measurement: attributing every conversion that touched any influencer post in a 30-day window to the influencer programme, with no control group, with no incremental lift estimate, then dividing by spend to produce a "campaign ROAS" headline. Most dashboards do this. Most CMO decks report it. It systematically over-states influencer contribution by a factor of 2-4x. If your finance team asks for a holdout-grounded estimate and the marketing team cannot produce one, the marketing team should not be reporting the campaign ROAS as a fact.
A Worked Example: $2,000/Month SMB Budget
Concrete budget for a small ecommerce brand running its first structured influencer programme:
- 8 nano creators × $200 per partnership = $1,600. Each receives a free product plus a small fee, posts once with usage rights for 90-day paid social, and gets a unique discount code.
- 1 micro creator × $400 partnership = $400. Same structure, longer-form content (Reel or YouTube short), broader reach for awareness layer.
- Tools and admin: ~$0 in month one (manual creator outreach via Instagram); shifts to a $50-$100/mo tool subscription (Modash or Aspire) once the operation scales above 15 creators per month.
What the dashboard should report after 90 days: discount-code-attributed revenue per creator, cost-per-acquisition by tier, a top-quartile creator list to renew at slightly higher fees, and a bottom-quartile list to cut. The campaign-level "ROAS" without a holdout is theatre. The per-creator deterministic ROAS, plus the renewed-creator subset, is signal.
What you can ship this Monday
The seven-section influence essay this article used to be is no longer the right framing for a 2026 readership that has watched the creator economy mature into a measurement discipline. The headline numbers ($5.78 ROAS, 161% UGC lift, 21% YoY adoption) are real but generously aggregated; the operating reality is that the brands extracting durable value from influencer marketing are the ones running unique codes per creator, auditing FTC compliance quarterly, and reporting a holdout-grounded incremental lift alongside the deterministic floor.
If you read nothing else from this guide, do this one thing on Monday: pull the last 90 days of your influencer-attributed revenue, separate it into deterministic (unique code) and inferred (last-touch click-through) buckets, and report only the deterministic number to finance for the next quarter. That single change will make the inevitable conversation about "why is the lift smaller than the dashboard said" much easier when it happens — because you will have already had the smaller, truer number on the slide.
Pick one creator tier to commit to. Negotiate 90-day usage rights into the next batch of contracts. Audit your FTC disclosure clause. The rest is just trend coverage.
Frequently Asked Questions
Lead with nano-influencers (1K–10K followers) at $25–$315 per post — they post 60% higher engagement than mega creators, drive significantly more weekly conversations, and let an SMB partner with 6–10 creators on a $2,000 monthly budget. Pair with affiliate or product-seeding compensation rather than flat fees, and repurpose top-performing creator content as paid social ads.
Per Hootsuite's 2026 data: nano-influencers (1K–10K) $25–$315 per post, micro (10K–100K) $160–$1,800, macro (100K–1M) $5,000–$10,000, mega (1M+) $1,200–$25,000+. The industry-wide ROI average is $5.78 returned per $1 spent, with top campaigns hitting $11–$18 per $1.
Disclosures must be clear, conspicuous, and immediately apparent — not buried in a comments section or behind 'more'. Any compensation (cash, free product, travel, discount codes) requires disclosure. AI-generated endorsements must be labeled as such. TikTok Shop affiliations beyond the built-in tag require explicit disclosure if extra compensation exists. Brands are equally liable as creators.
Yes — nano-influencers drive 2.71% engagement rates (50% higher than micros, 60% higher than macros), 82% of consumers say they're more likely to buy from a micro/nano creator than a celebrity, and 27% of marketers now make nanos their primary partner tier.
UGC is content customers create voluntarily (reviews, photos, social posts) without being paid; influencer marketing is a paid or compensated partnership. Both build trust — 96% of consumers rely on UGC for purchase decisions and UGC product pages convert 161% higher — but influencer marketing offers more campaign control and reach.
Track unique discount codes, UTM-tagged links, and platform-native attribution (TikTok Shop, Instagram Shop) for direct revenue. For brand campaigns, measure engagement rate, audience growth, branded-search lift, and earned media value. Use AI-assisted tools (Modash, Aspire, Upfluence) to baseline creator performance against historical benchmarks — and report the deterministic (unique-code) attribution alongside any inferred-lift estimate.