Visual Content Strategy: The Power of Infographics and Video Marketing in Digital Campaigns

Visual content strategy in 2026 is less about picking a format and more about running a system. Infographics, hero imagery, motion graphics, video, and the image-SEO and accessibility layer underneath all of them — these are five channels in a single visual programme, and the brands that treat them coherently outperform the brands that treat each one as a one-off campaign asset. 74% of brands now use infographics in their content strategy, up from 65% in 2025, with enterprise reaching 83%, and 75% of marketers report using AI tools to create visual content in 2025-2026. The discipline has expanded; the strategy hasn't always kept up.
This piece sits as the umbrella view of that system. Video is treated as one channel inside the visual programme, with the deeper format-specific guidance living in the video marketing strategy 2026 article. The bulk of the work below covers the parts of visual strategy that have changed most in the past two years — AI image production, image SEO for AI Overviews, accessibility as a growth lever, and the brand-system layer most marketing teams still skip.
The five-channel visual taxonomy
A working 2026 visual content strategy maps to five distinct channels. Each serves a different funnel position, and each has its own production economics. Trying to ship across all five without naming them as separate disciplines is how marketing teams end up with one-off assets and no system.
| Channel | Primary purpose | Typical placement |
|---|---|---|
| Brand-system visuals | Recognisable identity, hero imagery, photography | Owned site, sales decks, paid creative |
| Infographics & data viz | Compress complex information; earn citations and links | Blog content, social shares, PR |
| Motion graphics & looping | Attention capture without full video production cost | Social feeds, web hero modules, ads |
| Video | Sustained narrative, demo, conversion | Owned channel, YouTube, paid video |
| Image SEO & accessibility | Discovery, AI Overviews citation, compliance | Cross-cutting layer underneath every visual asset |
The taxonomy is useful less as a chart and more as a forcing function. Most "visual content strategy" decks fail because they conflate format choice (an infographic vs. a video) with channel choice (where the asset will be seen and what it must do). Pick the channel first; the format follows from purpose and budget.
Brand-system visuals: the layer most strategies skip
The 2026 reality of brand visuals is that they are increasingly assembled, not crafted from scratch. The leverage is in the system: a Canva Brand Kit, a Figma component library, design tokens, and an asset taxonomy that lets a small marketing team output consistent visuals at the volume the platforms now demand without grinding through a designer for every social post.
The components worth having in place:
- Defined colour, type, and image style documented in a shared design file. The "we know what our brand looks like" tacit version doesn't survive the third freelance contractor.
- A reusable component library — buttons, cards, social-post templates, blog hero templates, slide masters. Canva Brand Kit, Figma Components, and Adobe Express templates all support this.
- Original photography over stock. 2026 algorithms reward original imagery, with a minimum image resolution recommendation of 1200x1200, and authentic team or office photography functions as an E-E-A-T proof signal — both for traditional search and for AI Overviews citation. The "stock photo penalty" isn't a formal Google policy, but it's an observable pattern.
- A naming and tagging convention for the asset library. Sounds boring; saves the equivalent of a designer's salary in retrieval time within a year.
The teams that ship five visuals a week consistently are not faster designers. They are working from a system. The teams who ship one visual a week with great craft are not necessarily wrong, but they are doing different work — a campaign hero, not a programme.
Infographics and data visualisation in 2026
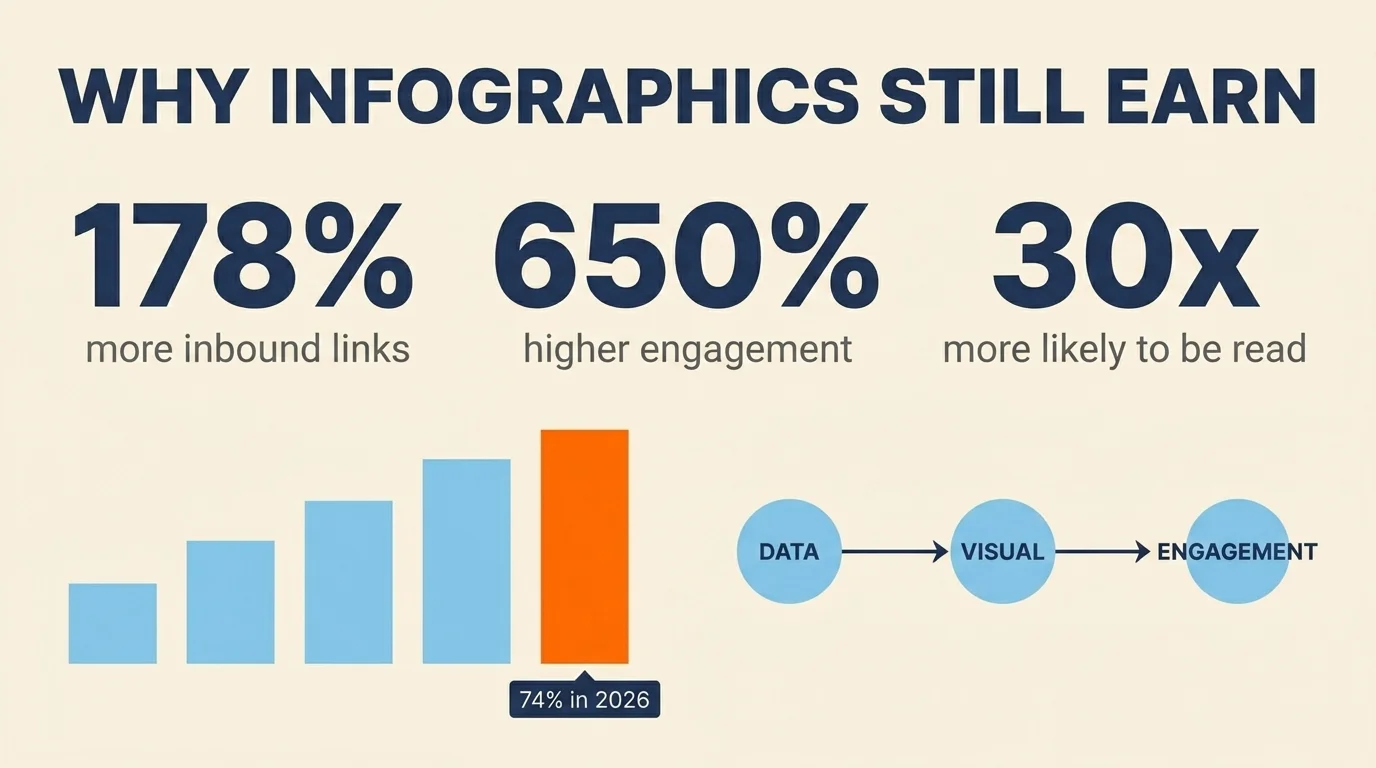
Infographics have aged well as a category because the economics of citation and link-building have not changed: information presented visually still travels further than information presented as text. The 2026 numbers continue to justify the production cost. Posts containing infographics earn 178% more inbound links and 650% higher engagement than text-only posts; infographics are 30 times more likely to be read than text articles, and people retain 65% of information when paired with relevant visuals versus roughly 10% for text only; interactive infographics with clickable elements or quizzes boost engagement by 200% and double time-on-page. Colored infographics increase attention and comprehension by 82% versus monochrome, and 88% of marketers report motion visuals (animated infographics, looping graphics) increase brand visibility.
What's changed is the production curve. 61% of infographic-adopting brands now use AI-assisted creation tools, cutting average production from 14 hours to 2.3 hours per piece. The implication is not that anyone should be making more infographics; it is that the bar for what's economically worth making has dropped, and a small team can sensibly include 1-2 infographics per content cycle where the same team would have produced none a couple of years earlier.
The categories that consistently earn linking and citation:
- Original-data infographics — proprietary survey, internal benchmark, year-over-year comparison.
- Process or framework diagrams — a step-by-step or a quadrant model that simplifies something complicated.
- Comparison and timeline graphics — side-by-side, before/after, evolution-of-the-thing diagrams.
- Animated or interactive variants of any of the above, where the data is rich enough to reward exploration.
The infographic that doesn't earn its keep is the recycled-stat decorative kind — five generic statistics in a vertical layout with brand colours. There is enough of that on the open web already.
AI-assisted visual production: the 2026 stack (and the legal posture)
The AI image generation layer has matured into a real production tool, and the choice of which generator to use is now a legal decision as much as a creative one. The split that emerged in 2025-2026 is largely between Adobe Firefly and everyone else.
Adobe Firefly is trained only on licensed Adobe Stock and public domain content and ships with full IP indemnification across paid Creative Cloud plans. Midjourney's 2026 Terms of Service explicitly disclaim liability for third-party IP claims; the Disney/Universal v. Midjourney trial is set for late 2026; and Bartz v. Anthropic settled at $1.5B in March 2026 — the largest AI copyright settlement to date. The practical implication: enterprise legal teams have increasingly stopped clearing Midjourney outputs for commercial use, and brand-marketing teams that route assets through legal review have largely defaulted to Firefly for client-facing work.
A working comparison matrix for the 2026 visual AI stack:
| Tool | Best for | IP indemnification | Brand-fidelity controls |
|---|---|---|---|
| Adobe Firefly | Commercial work, legally-cleared assets | Yes (paid CC plans) | Strong; integrates with Creative Cloud |
| Midjourney v7 | Internal ideation, mood-boards | No | Moderate; style references |
| DALL-E 4 | Text-in-image, illustrations | Limited | Moderate; prompt-engineering led |
| Stable Diffusion 3.5 | Self-hosted, technical workflows | No (open-source) | High via control models |
| Canva Magic Studio | Templates, brand-kit-aware generation | Partial (Canva-trained) | High via Brand Kit |
The realistic 2026 workflow most marketing teams converge on is a HITL (human-in-the-loop) pattern: brief → AI draft (Firefly for commercial-safe, Midjourney for ideation) → human review → brand-system polish → publish. The "AI replaces the designer" framing didn't survive contact with brand consistency; the "AI accelerates the designer's first-pass output" framing did.
Image SEO in the AI Overviews era
Image SEO has gone from "make sure images have alt text and aren't enormous" to a substantively more interesting discipline because of how AI Overviews actually cite visual content. The structural shift: more than 80% of searches in 2026 end without a click, Google AI Overviews now reach roughly 2 billion users, and AI search captured 12-15% of global search share in 2025. When the answer surface is an AI summary rather than a results page, images that get cited inside that summary become disproportionately valuable.
The mechanics that improve citation likelihood are not mysterious; they are mostly under-applied. 22.6% of organic e-commerce traffic now comes from images, and Google Lens generates approximately 12 billion visual searches per month, yet only about 26% of websites use alt text consistently and 53.1% of websites have at least one image missing alt text. The gap is enormous.
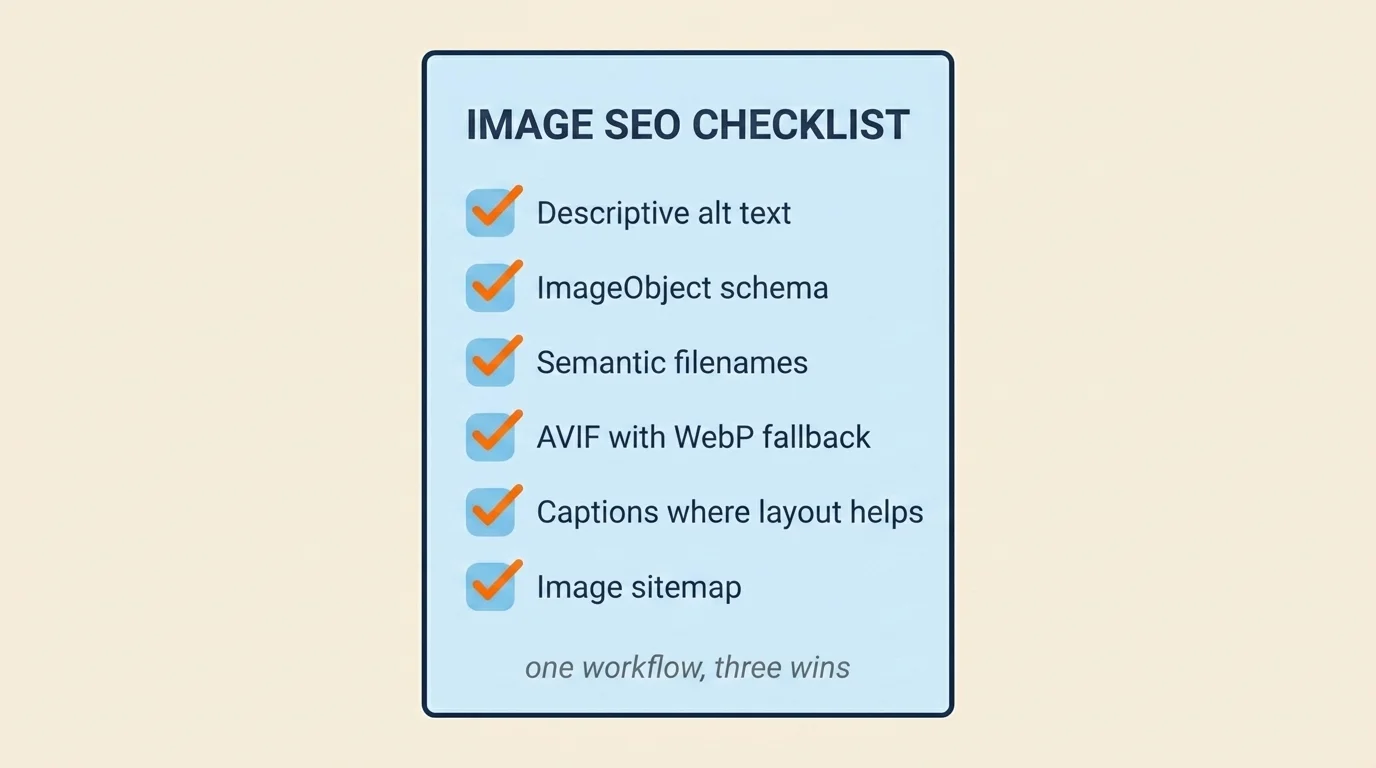
The 2026 image SEO discipline:
- Descriptive alt text of meaningful length (40+ characters on informative images) — describing the content, not stuffing keywords. This is now both an accessibility and an AI-Overviews ranking lever.
- ImageObject schema markup with
caption,creator,license, andcreditTextproperties. Tells the AI Overviews layer that the image is attributable and citable. - Semantic filenames —
seasonal-marketing-calendar-2026.pngrather thanimage-238.png. - AVIF as the default format, with WebP and JPEG fallbacks in a
<picture>element. AVIF delivers superior compression efficiency over WebP, which itself was roughly 34% smaller than JPEG, with measurable LCP and Core Web Vitals improvements. - Captions under images where the page layout supports them — captions are read more than body copy on most pages and feed semantic context into AI Overviews.
- Image sitemaps for sites with substantial visual content (e-commerce, media, design).
- Original-imagery preference over stock for the reasons described in the brand-system section above.
Semrush's 2025 AI search analysis found that content with transcripts, captions, and clear images with descriptive alt text was significantly more likely to be cited in AI-generated answers. The teams that treat image SEO as a checklist still occasionally hit; the teams that treat it as ongoing discipline build a citation surface.
Accessibility as a growth lever
The European Accessibility Act has reshaped what alt-text discipline actually means for marketing teams. EAA has been in force since June 28, 2025, with a private-sector deadline of June 2027 (public sector June 2026). Fines run €20,000-€250,000 per violation in the standard band, with German enforcement reaching up to €100,000 and Spanish enforcement up to €1,000,000. The compliance baseline is WCAG 2.1 / EN 301 549 — informative images require alt text, decorative images are explicitly marked as such, complex visuals (charts, infographics) need longer descriptions either inline or via aria-describedby.
The strategic framing that holds up: accessibility is not legal overhead. The same alt-text and caption discipline that satisfies EAA enforcement also drives AI Overviews citation rates and inclusive-audience reach. One workflow, three wins.
For video specifically: 85% of social video is watched on mute, which makes burned-in captions effectively mandatory in 2026 — for accessibility, for engagement on muted feeds, and for AI indexing. The earlier era of optional captions has ended.
Practical 2026 hygiene for accessibility-as-growth:
- Alt text on every informative image (40+ characters, descriptive, not keyword-stuffed).
- Decorative images marked with empty alt (
alt="") so screen readers correctly skip them. - Captions on all video content, including social.
- Colour contrast at WCAG 2.2 AA on all text overlays (4.5:1 for normal text, 3:1 for large text).
- Focus-visible states on interactive elements (often missed on custom infographic embeds).
- Long descriptions for complex infographics, either inline as a caption or via an
aria-describedbyreference.
For brands serving any EU audience, this is operational compliance with a June 2027 hard deadline. For brands not serving EU audiences, it's still good practice and good SEO.
A short note on video
Video is one of the five channels in this visual strategy but has earned its own depth treatment. The deep playbook — short-form vs long-form, TikTok/Reels/Shorts engagement benchmarks, AI video tools, shoppable and CTV, video analytics framework — lives in the companion Video Marketing Strategy 2026 guide. Within this umbrella article, video is the format you reach for when narrative time and conversion intent justify the production cost; when they don't, motion graphics, animated infographics, or static visuals are usually the better economic answer.
Production-budget tiering
A practical 2026 visual production stack scales roughly as follows. Most teams under-spend at the lower tiers and over-spend at the higher ones; matching the stack to where you actually are tends to outperform aspirational tooling.
- $0 / month — Canva free, alt-text discipline by hand, original phone photography. A small team can ship a credible weekly visual cadence at this tier.
- ~$500 / month — Canva Pro (or Adobe Express), Adobe Firefly subscription for commercial-safe AI generation, a Lottiefiles or Rive subscription for simple motion. Adds infographic templates, real motion graphics, and IP-safe AI imagery.
- ~$5,000 / month — Figma team licence, full Adobe Creative Cloud, a freelance designer or part-time contractor, and either a Wistia video tier or an enterprise stock-photo subscription. Adds brand-system maturity and the ability to produce custom-illustrated and animated infographics at scale.
- $25,000+ / month — Multiple in-house designers, paid AI generation budget (Runway, Veo, Kling subscriptions for video; Firefly enterprise for image), and dedicated motion-design and infographic-research roles. Enterprise programme territory.
The temptation at every tier is to jump one tier up. The realistic recommendation: master the current tier's output cadence, identify the specific bottleneck, and target the next tier's spend at that bottleneck rather than at general capability expansion.
Closing
Visual content strategy in 2026 is a five-channel system underpinned by image SEO and accessibility discipline. The strategic work is mostly choosing which channel does what, building the brand-system layer that makes consistent output possible, picking the AI tools that won't create legal exposure, and treating alt text and captions as growth levers rather than legal overhead. The teams that do this end up with a visual programme. The teams that publish "we should do more infographics" thinkpieces end up with one-off assets and no system. The lift in 2026 is in the system.
Frequently Asked Questions
Adobe Firefly is the only major generator that ships with full IP indemnification across paid Creative Cloud plans because it trains exclusively on licensed Adobe Stock and public-domain content. Midjourney's 2026 ToS explicitly disclaims liability for third-party IP claims, and the Disney/Universal v. Midjourney trial is set for late 2026. For commercial work, default to Firefly; use Midjourney for internal ideation only.
Use descriptive alt text (40+ characters per EN 301 549 guidance), ImageObject schema with caption, creator, license, and creditText properties, semantic file names, and modern formats (AVIF preferred, WebP fallback). Semrush 2025 found that pages with transcripts, captions, and clear images with descriptive alt text are significantly more likely to be cited in AI-generated answers.
More effective than ever — 74% of brands now use them (vs. 65% in 2025), they earn 178% more inbound links and 650% higher engagement than text-only posts, and interactive infographics double time on page. Original, data-rich infographics are also one of the strongest E-E-A-T signals for AI Overviews citations.
The European Accessibility Act has been enforceable since June 28, 2025, with a private-sector deadline of June 2027. Informative images on EU-facing sites need WCAG 2.1-compliant alt text (EN 301 549 standard, roughly 40+ characters). Fines run €20,000-€250,000, up to €1M in Spain. The same alt-text discipline boosts AI Overviews citation rates — one workflow, three wins.